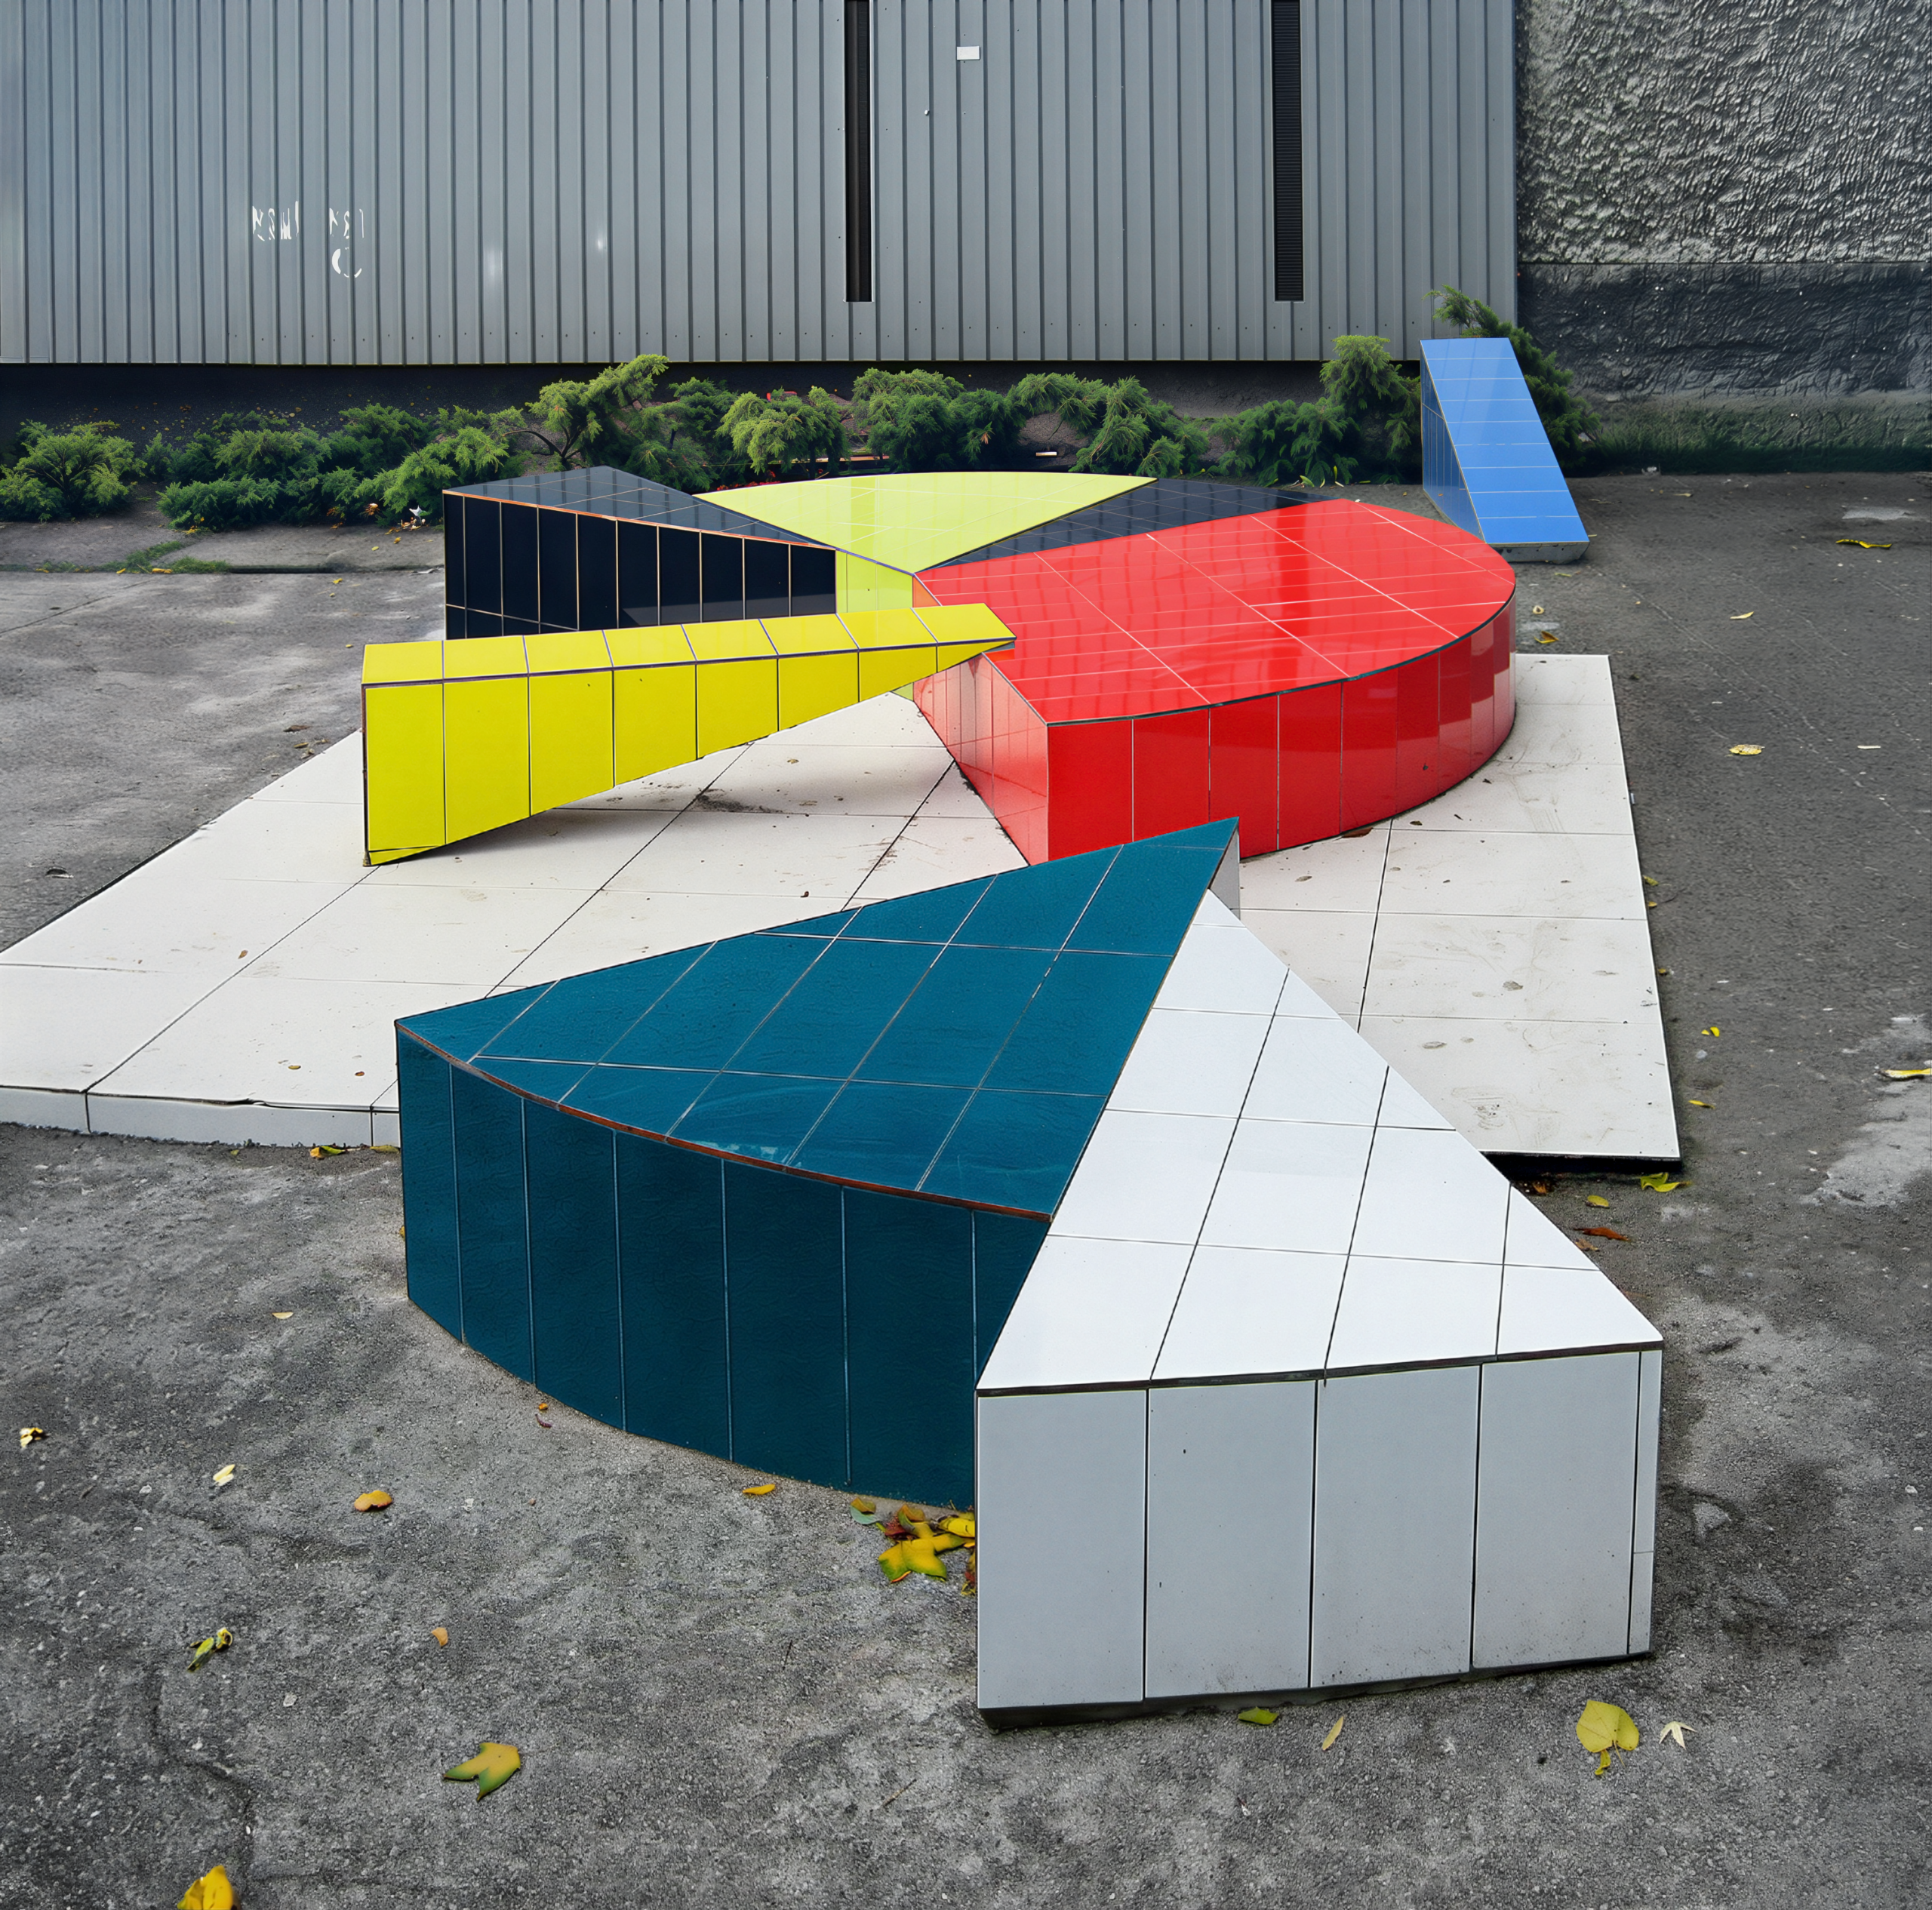
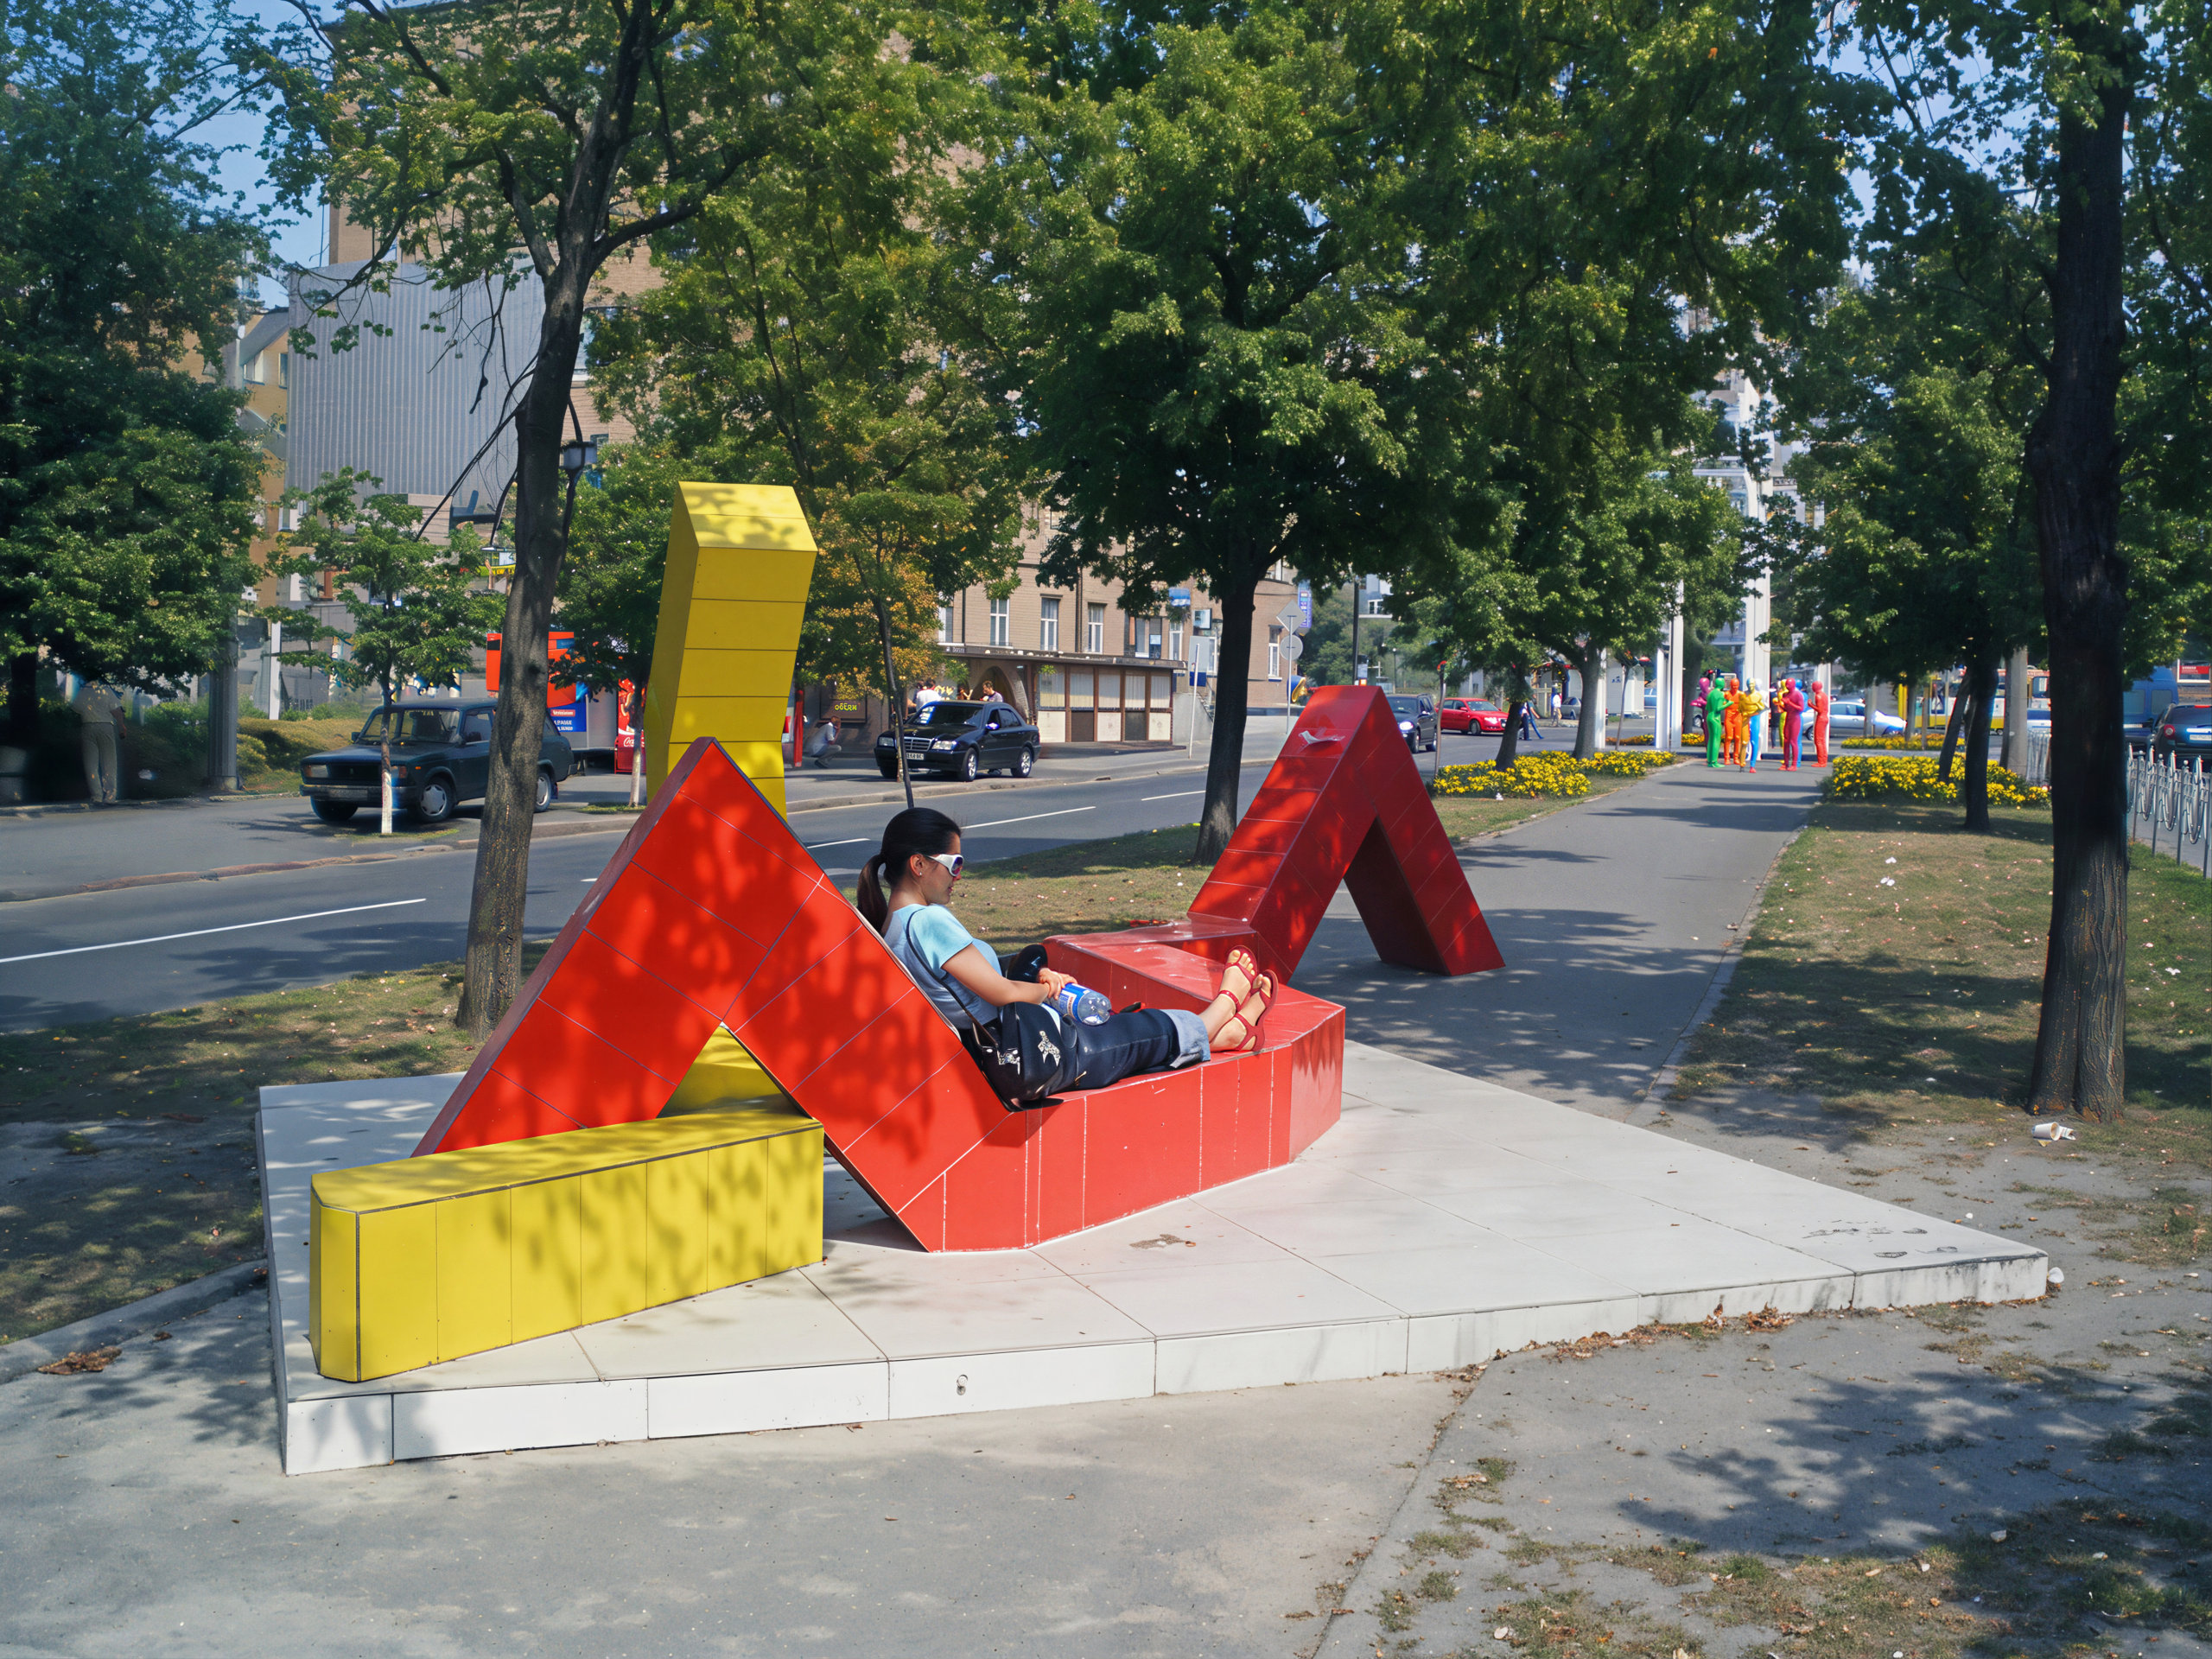
Zhanna Kadyrova. Pie Chart 01 from Calculation series. 2008–2009. Ceramogranite, cement, polyurethane foam. Variable sizes
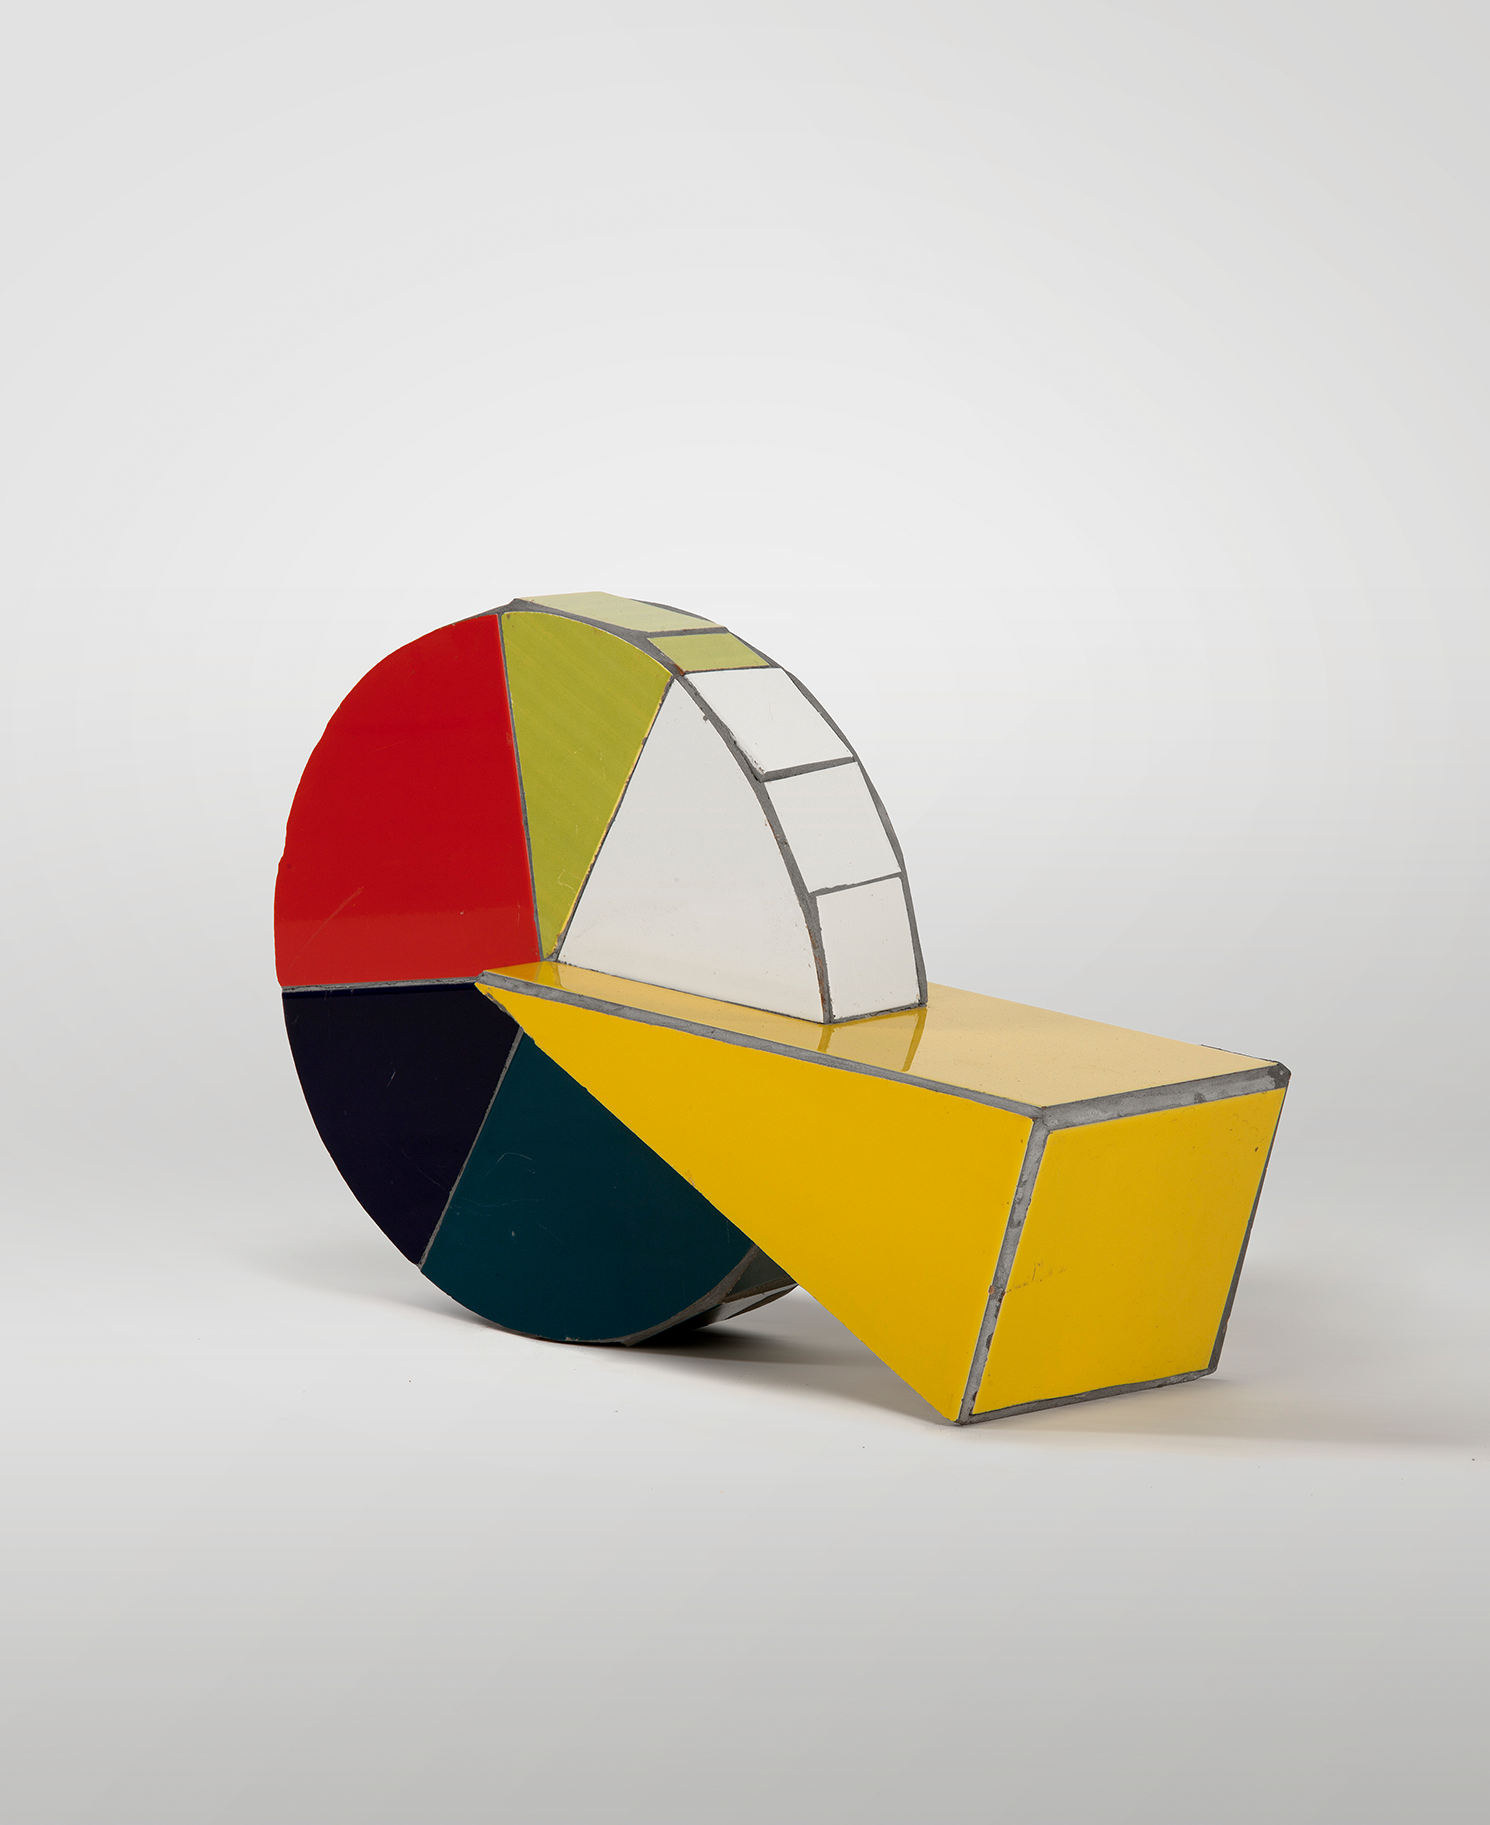
Series description
The series consists of sculptures that replicate the outlines of graphs, geometric shapes, and various types of calculations. The objects not only illustrate computational operations but go beyond the table, changing the logical direction or even “exploding.” Pie charts disintegrate because some segments, due to their enlarged sizes, extend beyond the figure, and certain curves deliberately detach from line graphs. The wild positions of the elements reflected the financial instability in the country. The artist embodied this concept at the beginning of 2008 — during a period of rapid inflation, currency devaluation, and the rise of corruption. Starting the project as a critique of the economic situation in the country at that time, Kadyrova foreshadowed the onset of the global crisis that engulfed markets a few months later.